Tuning forks for ultrasensitive force spectroscopy measurements
Link to PDF version of this app note
Introduction
Standard AFM-based methods to monitor mechanical properties of materials such as elasticity and adhesion are based on beam bounce or optical beam deflection technology (see Figure below). In this technology a laser beam bounces off the reflective back end of an appropriately chosen cantilever that is sufficiently soft to probe the material of interest The laser beam then tracks the bending of the cantilever or its amplitude as a surface is being approached , which is then analyzed to understand the mechanical properties of the material of interest.

With such an approach there are two major problems seen diagrammatically below. This schematic shows the tip-sample force as a function of time with two major sources of instability: the jump or snap into contact resulting in a discontinuity, which happens upon the approach, and then a second discontinuity at the point of withdrawal resulting in uncontrolled ringing of the cantilever. This is called Adhesion Ringing and is due to the fact that the adhesion force between the tip and sample is much stronger than the soft cantilever. Thus, the adhesion of the sample in effect plucks the soft cantilever like the string of a guitar, resulting in uncontrolled ringing that has to die down.

A better controlled experiment would include a smooth approach and retract by the tip so that the interaction is described by a smooth mathematical function as indicated by the dotted line.
An improved approach to force spectroscopy: tuning fork actuation and frequency based feedback
One way to avoid these discontinuity problems in the tip-sample interactions is to use the cantilever’s oscillation frequency instead of its amplitude as the feedback parameter. Very stiff cantilevers with very high Q oscillations are typically used in such experiments. The sharp frequency spectrum is very sensitive to small changes in the frequency imposed by ultrasmall forces of a tip interacting with a surface. This method is called Frequency Modulation.
An ideal example of a stiff device that is even self-oscillating (since it is formed of a piezo material) is a tuning fork, which also has very sharp resonance The higher the device Q the higher its sensitivity to any external perturbation such as surface forces. Thus, Frequency Modulation with tuning forks is ideal for force spectroscopy.
This method has been implemented among varied research groups1 1b, 2and have validated the fundamental force limits of a tuning fork that were estimated to be less than a pN nearly a decade ago3 . A Nanonics instrument recently demonstrated force sensitivity as predicted by Grober et al. in a beautiful study by Kohlgraf-Owens et al.4
These efforts have now been complemented by the pioneering theory of Sader and Jarvis5 that has shown theoretically that it is possible to derive accurate formulas for the force versus frequency in such Frequency Modulation methods.
Thus, tuning forks whose force constants are many orders of magnitude larger than standard silicon cantilevers have significant advantages in force spectroscopy measurements over conventional cantilevers. By using such stiff tuning forks, the problems in classical silicon cantilevers of jump to contact and adhesion ringing are avoided. Tuning forks provide high sensitivity especially in the region of very close tip-sample contact. This region could not be addressed previously because of the discontinuities in the measurement but is now accessible.. Tuning fork feedback also provides other advantages, such as in electrical measurements, where in many semiconductor devices the feedback laser causes induction of carriers. Finally, tuning fork feedback does not employ a laser so that there is no laser feedback interference for electrical and optical spectroscopy measurements.
Deriving model parameters from tuning fork based force spectroscopy
Tuning forks have force constants of 2,400 N/m and so their Q is much higher than the tens or hundreds of N/m force constants of rectangular cantilevers. The DMT model can be used to model force curves collected with tuning forks.
Finteraction is the force between the tip and sample
E* is the reduced elastic modulus
R is the tip radius
d0 is the surface rest position
Fadh is an adhesion force
Discontinuities and hysteresis in the force curve can affect accurate measurement of the parameters that go into the DMT model. A jump to contact instability prevents direct measurement of “do” and so the Finteraction between the tip and the sample will also be complicated. Furthermore, if there is adhesion ringing then similarly the adhesion force can be difficult to assess.
Determining the DMT model parameters using a tuning-fork based setup is straightforward. With frequency used as the feedback parameter, amplitude can now be monitored as a separate independent quantity. When a tuning fork with a tip approaches the surface with frequency feedback, the oscillation amplitude is measured independently. Thus the point at which the tip touches the surface is observed immediately since one sees an amplitude change independent of any effect of feedback. Furthermore, this occurs without any jump to contact so one knows the exact point of contact or “do” in the equation above.
This is shown practically in the Amplitude vs Distance graph below. As the probe approaches the surface from the right on the graph, from I, the point at which the slope abruptly changes, T, is the point of contact or “do”. The intersection of the straight line I T and the straight line TM now define “do”. M is the point of greatest penetration or indentation. Similarly the point of retraction from the surface without ringing is readily and smoothly determined by the intersections of MR with the straight line RF.
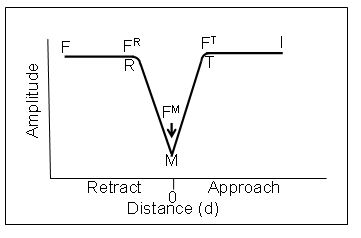
The forces measured at T (FT) M (FM) and R (FR) are the Finteraction,
Fmaximum or peak force and Fadhfrom Sader and Jarvis [J. E. Sader and S. P. Jarvis.5 We now have accurate formulas for the changes in Q, which is related to frequency, during the force distance curves. Therefore, the forces at T, M and R can readily be determined even in ultra close proximity to the surface without any jump to contact or adhesion ringing and all elements of the DMT equation are known experimentally. Note that the amplitude distance curves do not have to be symmetric. They are only symmetric when there is no adhesion force.
Nanonics in collaboration with the Continuum Mechanics and Material Theory Faculty at the Technical Univeristy of Berlin has tested the implementation of the equations of Sader and Jarvis. These tests are based on extensive experiments with calibrated micromechanical suspended cantilevers with accurately determined force constants both theoretically and by other experimental methods. An example of such measurements is shown below.
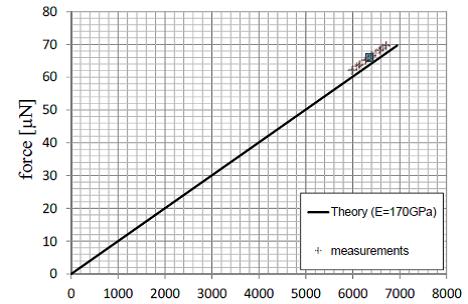
The microbeams allow for the imposition of relatively large forces that enable direct comparison of the beam bounce method with theoretical results and with the tuning fork measurements. The solid curve above is a theoretical curve of the Force. The measurement points are shown and the data compare well with the theoretical results.
Now let us compare the tuning fork results on the same cantilever on the graph below.

The blue curve is obtained with the tip at the point where the microbeam is attached to the bulk silicon support where any bending detected is the result of the probe and can be used as a correction if needed. The red curve is at the free end of the microbeam and the force is calculated with the Nanonics Software by measuring the frequency change and applying the Sader and Jarvis equations. The yellow line is then generated by subtracting the extrapolated blue curve from the red curve; the blue curve can only be obtained at low force without breaking the tip since this curve is obtained at the inflexible point of the connection of the microbeam to the silicon support. This removes any effect of probe bending which is in any case very small in this case with such a large force constant.
Now let us compare the slope of the yellow curve in the tuning fork measurements with what was measured by the beam bounce. They are identical. Thus, the Sader and Jarvis equations as implemented by the Nanonics program accurately determine the known force constant of these test microbeams with the curves crossing zero as would be predicted for 0 Force.
Thus, today Nanonics is pleased to allow our customers a level of accurate force measurements with a variety of functional probes (optical, electrical, thermal, chemical deposition etc) that has till today been impossible to achieve by other techniques.
References
1. (a) Ternes, M.; Lutz, C. P.; Hirjibehedin, C. F.; Giessibl, F. J.; Heinrich, A. J., The force needed to move an atom on a surface. Science 2008, 319 (5866), 1066; (b) Gross, L.; Mohn, F.; Moll, N.; Liljeroth, P.; Meyer, G., The Chemical structure of a molecule resolves by atomic force microscopy. Science 2009, 325.
2. Albers, B. J., Three-dimensional imaging of short-range chemical forces with picometer resolution. Nature Nanotechnology 2009, 4, 307.
3. Grober, R. D., Fundamental limits to force detection using quartz tuning forks. Review of Scientific Instruments 2000, 71, 2776.
4. Kohlgraf-Owens, D. C., Mapping the mechanical action of light. Phys Review A 2011, 84, 011807R.
5. Sader, J. E.; Jarvis, S. P., Accurate formulas for interaction force and energy in frequency modulation force spectroscopy. Applied Physics Letters 2004, 84, 1801.