


Super User
Wednesday, 23 March 2016 13:51
NSOM
Unique Protocols for the Highest Optical Resolution
Nanonics MultiView SPM systems are designed for the ultimate in AFM/NSOM performance and for seamless integration with online techniques such as optical microscopes, confocal, Raman etc. Such performance and integration is obtained due to a complex of SPM technology innovations of scanning stages, ultimate in AFM feedback and optically transparent probes pioneered by Nanonics. Such innovations allow for complete integration of the SPM head with conventional optical microscopes including upright, inverted and dual optical microscope configurations. The free optical axis from above and below the sample allows for performing all near-field and far-field modes of transmission, reflection, collection and fluorescence. In addition, unique apertureless NSOM (ANSOM) protocols are provided with specialized probes and specialized multiprobe SPM geometries.
Nanonics MultiView systems incorporate the following unique features which have led to numerous new understandings in the area of NSOM, Optical Resolution, nanophotonics and plasmonics. In the last two decades, hundreds of research papers have been published using Nanonics Muliview systems.
Published in
newgallery
Tagged under
Tuesday, 08 March 2016 14:03
Scanning Polariton Interferometry
 By combining the best of both worlds that photons and electrons have to offer, polaritons hold much promise for a variety of applications in optoelectronics and nanophotonics such as miniatiruzed circuits for improved information or energy transfer. Polaritons are hybrid or quasi particles that are made up of photons strongly coupled to an electric dipole. There are different kinds of polaritons such an electron-hole pair that form an exciton polariton, which is present in semiconductors, or electrons at a metal surface that create surface plasmon polaritons (SPPs). Exciton polaritons that are stable at ambient conditions are an active area of research interest. A particular group of semiconductor chalcogenide materials was recently identified to have the existence of polaritons under ambient conditions. However, these materials were previously investigated using far-field methods. These materials are important for their potential applications in information technology, bio-sensing and metamaterials.
In this work, a team of researchers led by Prof. Xu of University of Washington use a Nanonics MV 4000 operating in reflection NSOM to study waveguide polaritons in thin <300nm flakes of WSe2 at ambient conditions. Using this setup, they could directly excite and probe polariton modes by imaging their interference fringes in a method termed “scanning polariton interferometry” at different wavelengths to map out the entire polariton dispersion both above and below the excitation energy. In this study, the polaritons were observed to have a wavelength down to 300nm in WSe2 and propagate many microns below the excitation energy. The near-field illumination allowed for the first time direct excitation and real imaging of the exciton polariton without the need for complicated cavity fabrication. Furthermore, by tuning the excitation laser energy it was possible to map the entire polarity dispersion.
To learn more about any Nanonics Systems feel free to contact us and speak to one of our experts. |
Published in
Publication Highlights
Tagged under
Sunday, 28 February 2016 08:31
"Cold" off the Press Research with the CryoView

Nanonics congratulates Y. Chen and Professors Olog Holtz, Jens Birch and Fredrik Karlsson of Linkoping University in Sweden on their recently published paper "Determination of critical diameters for intrinsic carrier diffusion length of GaN nanorods with cryo-scanning near field- optical microscopy” (Scientific Reports, 6, p. 21482). These researchers used a Nanonics CryoView to measure GaN nanorods with diameters of 50-800nm. Using a 50nm apertured fiber probe and reflection NSOM operating at 10K, the authors mapped the photoluminescence to measure the carrier diffusion, as seen below in the photoluminescence image overlaid onto the topography of these nanostructures.

Published in
News
Tagged under
Tuesday, 09 February 2016 08:34
Controlled steering of Cherenkov surface plasmon wakes with a one-dimensional metamaterial
Patrice Genevet, Daniel Wintz, Antonio Ambrosio, Alan She, Romain Blanchardand Federico Capasso
Nature Nanotechnology PUBLISHED ONLINE: 6 JULY 2015 | DOI: 10.1038/NNANO.2015.137
When a charged particle travels faster than the phase speed of light in a medium, a photonic shock wave called Cherenkov radiation is emitted. This electromagnetic shock wave is emitted as a cone in the three spatial dimensions. In this paper it was shown that a two dimensional analogue of Cherenkov radiation can be created to control and steer plasmons in one-dimensional metamaterials.
| A one-dimensional metasuface was fabricated for the experiment, which consisted of an array of slits in different directions etched in the thin metal film. S-polarized light illuminates the metasurface in far-field and creates running waves of polarization (RWP). The RWP can be understood as a series of dipoles oriented normally to the slit axis | |
| with different phases generated along the metasurface. These dipoles interact with the local distribution of free electrons on the metal surface and radiate SPP waves along the metal–dielectric surface. The RWP propagation speed is always larger than the SPP phase velocity. | EM image of nano- array structure |
| Thus two-dimensional Cherenkov radiation is generated in the metasurface. | |
| Moreover both experimental and theoretical analyses have showed that the direction of the Cherenkov radiation depends on the | |
|
angle and spin of the incident polarized light. Thus the propagation direction of the Cherenkov radiation can be controlled and steered by either one of these parameters.The experimental results show that that the direction of the SPP wakes depends on the angle and spin of the incident light. Thus the steering of the SPPs wakes can be achieved by variation of either one these parameters. The propagation direction of the two- dimensional Cherenkov radiation can be steered from forward to backward. The experimental results are in the good agreement with the theoretical simulation. The obtained results are very important step toward in understanding of the SPPs wakes propagation. The ability to control and manipulate of the SPPs propagation direction opens new horizons in development of novel plasmonic devices such as plasmonic phase modulators, plasmonic couplers, plasmonic holograms and beam-steering devices. |
 Experimental results. Forward Cherenkov SPP wakes (left), backward Cherenkov SPP wakes (right). Θ is angle of circular polarized incident light; σ+ and σ- are spin of the polarization, ϒ angle of Cherenkov SPP wakes propagation |
Experimental Setup:
The experimental analysis of the SPPs wake propagation was performed with a Nanonics Multiprobe MV 4000 near-field optical microscope in collection mode (with the NSOM probe collecting the light into a detector). The MV 4000 allowed for such an experiment as a result of the following advantages:
- Free optical access of the NSOM head from the both the top and the bottom. Allowing for direct illumination of the sample from below and easy visualization of the tip and sample from above.
- Tip scanning allowing NSOM mapping of the SPP independent to the illumination and without moving the sample.
- Topographic and near-field optical data are acquired simultaneously by scanning with Nanonics cantilevered NSOM probe.
- Tuning fork (TF) feedback allows for no optical AFM feedback and no optical interference with the measurement
- It is important to note that Apertured NSOM is important for such an experiment as an apertureless NSOM configuration would require laser illumination at the tip which can interferes with the Cherenkov radiation and lead to optical artifacts.
Published in
Publication Highlights
Tagged under
Sunday, 07 February 2016 08:38
First Nanonics AFM System in India Showcased for Minister
Dr Harshvardhan, Union Minister of Science and Technology, Government of India visited AGARKAR Research Institue to see an AFM demonstration on a Nanonics system. This system was purchased in 2004 and is still in use today. Since then, many Nanonics Imaging systems are operational at other research institutes and universities in India.
Deprecated: Methods with the same name as their class will not be constructors in a future version of PHP; Tableigallery has a deprecated constructor in /home/nanonics/public_html/administrator/components/com_igallery/tables/igallery.php on line 6
Warning: count(): Parameter must be an array or an object that implements Countable in /home/nanonics/public_html/components/com_igallery/views/category/tmpl/default_main.php on line 18

The following is an email Nanonics Recieved from Labindia about the event:
Dear All,
I am pleased to inform you that Dr.Harshvardhan, Union Minister science and technology, Government of India visited AGARKAR Research Institute, Pune on 3rd February 2016. We have setup our AFM for demonstration before their visit and he has visited AFM lab and also discussed with scientists about their research and use of AFM. I also want to inform you that this AFM setup is nearly 11-12 years old.
Please find some photographs which we have got from ARI Pune .these photographs collected when Dr harshvardhan was in AFM LAB and was seeing system and discussing for research with scientists.
Thanking you.
Best Regards
Mohit Gautam(+91-8506909030)
NBP Division-Labindia instruments Gurgaon
Published in
News
Tagged under
Wednesday, 27 January 2016 08:05
AFM SEM/FIB Resource Library
AFM SEM/FIB
Resource Library

Quick Links
Introduction
Introduction
Scanning electron microscopy (SEM) and ion beam milling techniques are mature nanoscale measurement technologies, whereas atomic force microscopy (AFM) is a developing technology generating intense interest in the scientific community for basic research and development. These techniques have generally existed in separate worlds. This article discusses a capability that marries these technologies through an instrument recently introduced by Nanonics, the 3TB4000.
Hybrid methodologies are becoming more important as research needs continue to push the development of characterization tools that provide a more complete understanding of materials. In combination with the growing and pervasive needs of nanotechnology, the use of hybrid methods to study material properties with nanoscale spatial resolution is at the forefront of instrumentation in both research laboratories and industry.
For the Nanonics 3TB4000, development focused both on instrumental compatibility and on the new research directions that such a combined tool could take for improved characterization of materials. The development of the Nanonics 3TB4000 has been a part of an integrated microscopy program, which included combining light optics with AFM [1], Raman chemical analysis and AFM [2], and mass spectroscopy with AFM functionality [3]. These technique combinations have resulted in unique capabilities unachievable with any of the above instruments alone. This article gives the reader a first glimpse at the emerging union of AFM with SEM/FIB.
Innovations in Instrument Design
The challenge has been, as in all such integrations, to maintain full functionality of each individual technique while at the same time enabling new materials characterization capabilities through integration that did not exist previously. Historically there have been several barriers to the effective merger of AFM methodologies with other microscopical or analytical techniques. This section describes the innovations in scanner, probe, and feedback loop technology and design to overcome these barriers.
Scanner
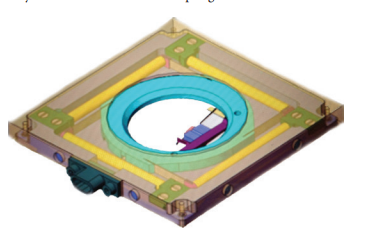
The AFM scanner controls the fine X, Y, and Z motion of either the sample or the tip in the instrument, depending on the instrument configuration. These scanners often employ cylindrical piezoelectric elements. These elements in the upright configuration possess limited Z range and a geometry that obstructs integration with an electron and ion beam. On the other hand, a cylindrical piezo device permits large ranges of X and Y motion perpendicular to the long axis of the piezo. To thisend Nanonics has developed a 3D UltraFlat Scanning stage with 4 cylindrical piezos (see schematic in Figure 1), enabling large ranges (85 µm or greater) in X, Y, and Z. This new stage allows for a variety of geometries of AFM systems in confined spaces such as electron and ion beam microscopes.
Probe
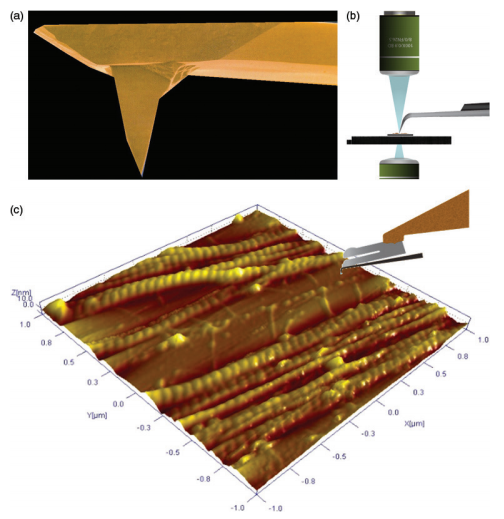
A second element that has limited hybrid tool advancement is the AFM probe. Specifically, the probe requires a design that enables the tip of the probe to be exposed to the electron/ion optical axis. Most AFM probes are manufactured from silicon-based materials that form an opaque barrier for visualization of the tip from (Figure 2a). A few manufacturers do provide a geometry where the tip is slightly visible from the top (for example, AdvancedTecTM probes from Nanosensors); however, these probes are generally limited to topography analysis. Nanonics has developed the NanoToolKitTM of fused-silica-based probes with full visualization of the tip and full functionality for experiments, including electrical and thermal measurement [4], optical measurements [5], and material [6] and gas deposition. This enables new horizons of AFM combinations with electron/ion beams. A schematic of a fused silica probe with full visualization of the tip from the top is shown in Figure 2b.
Feedback loop
The final barrier to AFM/SEM/FIB integration has been the feedback loop that uses the standard reflection of laser light, bounced off the back of a cantilever and directed toward a position-sensitive detector, to measure amplitude changes. This approach is so universally applied that it is rarely questioned. However, such an approach uses very soft cantilevers with low spring constants. When such cantilevers are oscillated in intermittent contact mode, the most common mode of non-destructive imaging in an AFM, they show a broad spectrum of oscillation frequencies with a low sensitivity or Q factor.
To obtain high Q factors one needs stiff cantilevers with a narrow spectrum of oscillation frequencies. Normal force tuning-fork-based geometries have been recognized as having stiff cantilevers with a sharp frequency spectrum [7]. Thus, the normal force tuning-fork-based geometry provides the ideal platform for the NanoToolKitTM of fused-silica-based probes. With such a combination of stiff cantilevers using tuning-forkbased feedback, the force of a photon has been measured to be 1.6 pN, which is a significant improvement over the best beam-bounce-based feedback results [8]. Furthermore, this combination overcomes the well-known instabilities in soft cantilevers, such as the jump to contact instability when a probe is approximately 20 nm from the surface or the adhesion ringing instability when a probe is lifted off a surface. These instabilities allow only an approximation of the point of tip-sample contact, which is important to measure accurately in order to measure material elasticity. Tuning forks avoid these instabilities with very stiff cantilevers and thus have high Q, high sensitivity, and a narrow spectrum of oscillation frequencies, allowing the frequency rather than the amplitude to be the source of the feedback. Nonetheless, the amplitude can still be measured independently of the frequency feedback that is used. This gives the crucial point of contact without any calculation. This is a critical and essential element of AFM for the measurement of mechanical properties of materials, which no SEM or FIB can accomplish.
With this combination of ultrathin scanners (Figure 2a), exposedtip functional probes (Figure 2b), and normal force tuning forks with such probes (Figure 2c), the AFM hardware now allows unsual geometries with high sensitivity permitting new integrations with standard analytical tools such as SEM and FIB systems.
Results
The combination of these three capabilities into one instrument allows for new measurements not previously possible (Figure 3). We describe here a few examples exhibiting the 3TB4000’s benefits and capabilities.
Improved field of view
One interminable problem with SPM technology is the limited field of view. Thus, an immediate improvement in this limitation of SPM technology is seen in Figure 4 where one is able to zoom into a specific ZnO nanowire from a field of 600 µm to 40 µm. This has recently allowed the measurement of the optical attenuation coefficient of a particular ZnO nanowire using the near-field optical capability of this hybrid technology [9].
Imaging an FIB milled trench
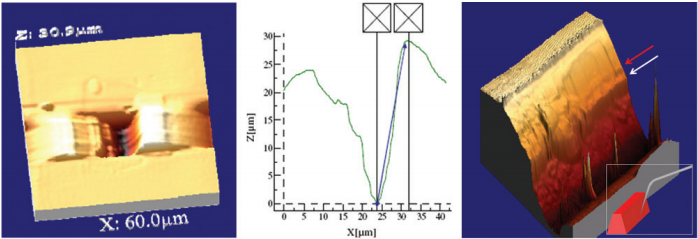
Figure 5a shows an AFM image profiling a 25-µm-deep trench with the large Z range of the system, both in terms of the scanner and the long exposed tip. The example in the figure is a trench milled in silicon with FIB. In this measurement, the FIB beam was used to mill this feature, and it was followed immediately by AFM imaging without having to remove the specimen from the FIB chamber and search for the feature of interest with the AFM. Furthermore, the true depth of the trench was measured by the AFM in a cross-sectional profile (Figure 5b), while a 3D reconstruction revealed the geometry of the sidewall (Figure 5c). Sidewall imaging with long and exposed tips becomes feasible with the 3TB4000 (see Figure 5c). The red arrow in this image clearly shows a Pt decoration on this structure, and the white arrow shows an undercut. SEM is severely limited in such imaging tasks.
In situ milling measurements
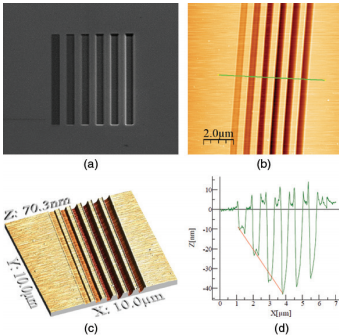
The ability of AFM to quickly and easily follow FIB milling with high Z resolutionprovides a straightforward and convenient method for checking FIB milling results. This capability is demonstrated in Figure 6 where several FIB-milled features in Si were monitored during the milling process. The grayscale SEM image in Figure 6a can easily locate these features and measure their widths but cannot provide direct information on their depths. The AFM delivers an equivalent top-view image (Figure 6b), a 3D reconstruction (Figure 6c), and a cross-sectional profile(Figure 6d) that together provide a true topographic map of specimen features. The depth profiles demonstrate the linearity of the etching process with time.
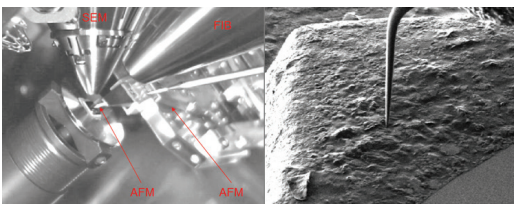
In situ measurements of AFM tip condition
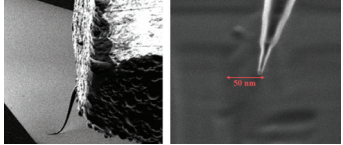
The benefits of AFM also can be seen in Figure 7 where the SEM image shows a fused silica AFM probe in contact with a surface under a controlled force. Figure 7a shows that the AFM probe is in contact with the surface, depressed, and even deformed by this interaction. In Figure 7b, the probe has been removed from the surface, and so it has relaxed and recovered its original shape without seriously affecting or compromising the tip shape. The SEM can be used to assess AFM tip condition at any point of the experiment, as shown in Figure 7c. An evaluation can be made concerning whether the tip has worn or been contaminated to the extent that it needs to be replaced. This adds validity to AFM measurements since there are often questions regarding the integrity of the AFM probe tip after any interaction with the surface. Furthermore, the lateral resolution in AFM is the convolution of the probe tip geometry with the sample geometry; this can now be directly assessed on-line at high resolution.
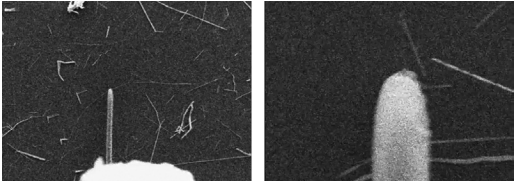
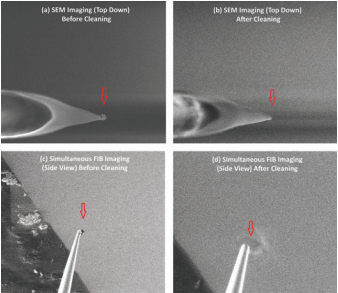
If the tip has been contaminated during the imaging process, the FIB can be used to remove the contamination,and both the FIB and the on-line SEM can be employed to see the results of the cleaning. Figure 8 shows such a cleaning through imaging in top down images before and after cleaning (8a and 8b) and side view images before and after cleaning (8c and 8d).
Material property measurements
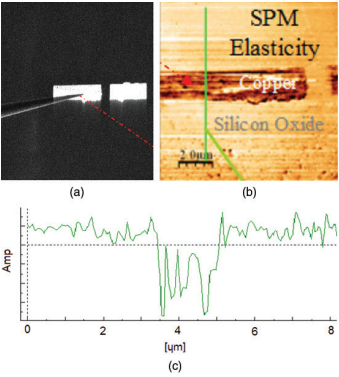
In addition to important imaging tasks, the AFM is capable of measuring various properties of materials. One of these features, which is especially relevant in SEM and FIB, is the measurement of the elasticity within hybrid structures. An example of this measurement is shown in Figure 9 where the SEM was used to guide the AFM probe (Figure 9a). The AFM measures a lower elasticity in soft copper metal, which differentiates it from the surrounding stiffer silicon oxide in Figure 9b. The softer copper and the harder silica also have the effect of a trampoline on the probe; the probe experiences larger amplitudes on the harder surface. The line profile of the amplitude in Figure 9c was taken from the green cross-sectional profile in Figure 9b. The tuning fork in normal force mode hasamplitude as a measured parameter that is independent of the feedback. With such probes one can effectively monitor mechanical damping on-line without the need for digitization or further analysis of the intermittent contact mode amplitudes where the probe is contacting the surface at some defined frequency.
Monitoring nanofabrication processes
The FIB is increasingly used for nanofabrication with the requirement foraccurate Z control. The ability of an on-line AFM is useful in defining the effectiveness of such fabrication processes.
Conclusion
The Nanonics 3TB4000 incorporates innovations in the design and technology of atomic force microscopy enabling its integration with SEM and FIB technologies into a single powerful capability. Innovations in scanner design, probe manufacturing, and feedback loop have enabled this useful integration, resulting in a tool more powerful than its individual components. Several examples are shown where the SEM, FIB, and AFM are used together to provide complimentary information about the material. This will likely lead to the next generation of 3D functional analysis of devices, highlighting the disruptive nature of this technological synergism.
Published in
Learn and Discover
Wednesday, 20 January 2016 14:11
Nanolithography Resource Library
Nanolithography
Resource Library
Introduction
The field of ambient chemical nanolithography technologies was born in 1999 with two papers. One paper was based on the dip pen concept where to achieve the smallest writing dimensions a dry molecular ink was coated on an atomic force microscopy like probe [1]. This method was called dip pen nanolithography (DPN). A second paper was based on the concept of a fountain pen [2] and fully employed atomic force microscopy
(AFM) and its feedback mechanisms but the writing element used was a nanopipette. This paper focuses on fountain pen nanolithography (FPN) and its evolution into a powerful generally applicable chemical writing method on many length scales with many surfaces and utilizing a wide variety of inks including gases.
The technique in general uses a quartz cantilevered nanopipette with a tip highly exposed to the optical axis as seen in Figure 1.

Such an exposed tip has great advantages over other probe technologies where the tip is generally obscured from above by the cantilever

Furthermore, other functional probes such as electrical, thermal, electrochemical and Kelvin probes can also be on-line to investigate the writing process at different time points. A movie of FPN with multiprobe AFM characterization can be seen on the web
In FPN it is becoming increasingly evident that its generality arises from critical wetting interactions between the ink and surface that is chosen (Figure 1b). For comparison, in DPN the molecules are delivered to the surface through a water meniscus and the deposition rate is dependent on the diffusion rate of each molecule. This process has drawbacks since each molecular ink is limited only to its corresponding substrate, the diffusion process is relative slow and the method only works in contact with the surface.
In FPN there are several important parameters that readily allow for control of the ink deposition. One such parameter is the induction of pressure by either imposed voltages over the column of liquid [6], or the imposition of a defined pressure from the back of a liquid column. In the case of gases this pressure can be differential between the inside of the pipette and the surrounding environment (see Figure 5). In addition to such control, several AFM parameters also have an influence on the writing, namely the nanopipette aperture, the speed (see Figure 5), the imposed force of the tip to the surface (set-point) (see Figure 6), the mode of AFM operation (contact or non-contact) etc. Generally the humidity effects are not as critical as in DPN which depends on an aqueous bridge that arises from the surface wetting.
Presently, knowledge is rapidly accumulating in the FPN field that allows for the effective use of the generality of the method in numerous areas of fundamental and applied science. This article is aimed at leading the reader to an understanding of these advances.
Materials and Methods
Probes and Feedback
The probes used were glass cantilevered nanopipette capillaries with diameters that varied from 35 nm to 10 microns. These probes were used either with beam bounce amplitude feedback or complexed to tuning forks for implementing tapping mode normal force tuning fork operation. Tip approach, feedback and scanning are under atomic force microscope control.
As noted above both contact and non-contact AFM can be used with FPN. The advantage of non-contact is that one can consider writing on very soft surfaces which would be difficult to access with contact mode operation. In addition, tuning forks allow for true non-contact operation. This is difficult to achieve with beam bounce silicon cantilever methodologies due to jump to contact instabilities in AFM silicon probes when they approach less than ~10 nm above the surface.
In tuning forks, this unique behavior of no jump to contact and no adhesion ringing is achieved due to the much stiffer (>3 orders of magnitude) force constants of 2,600 N/m relative to silicon AFM cantilevers. This stiffness gives tuning forks the attribute of ultra sharp frequency spectra with high Q factors and associated force sensitivity that permit feedback based on frequency modulation. In addition, such high Q factors, when complexed to glass probes that by themselves are relatively stiff with a few N/m force constants, allow for the ultimate in force sensitivity for glass based probe technology. This is achieved by the sharp frequency spectrum that permits frequency and not amplitude as a monitor of the force. In fact, it has been demonstrated, that with such a combination of tuning forks and glass probes, a force sensitivity of 1.6 pN can be reached, which is much higher than what can be achieved by the best beam bounce technologies available today[7]. Therefore, the ultimate in force microscopy can be readily integrated with the chemical writing process and this is presently in its infancy in FPN.
Both this aspect of sensitive force detection with no jump to contact and adhesion ringing allow for relatively difficult tasks such as writing on, for example, thin carbon membranes that are found in certain transmission electron microscopy grids.
Surfaces and Inks
In Table is a summary of the surfaces and inks that have been used in various combinations in the writing process with FPN. In this paper, many of these examples are seen or are in the published literature and will be explained below in the Results and
Results
The results shown in the figures demonstrate the generality of inks and surfaces in the FPN writing process as indicated above. In Figure 2 different surfaces, different inks and different dimensions are all shown. Even the ability to write with liquid inks on structures previously written by other lithographic processes is demonstrated and the ability to over-write structures previously written by FPN is shown for the case of the Star of David in Figure 2b. A movie of this latter writing process can be viewed on the web [8].
Inks>: Carbon Nanotubes, Salt Solutions & Nanoparticle Suspensions Surfaces: n Type Silicon, Si02, Organic Photoresist & Gold
InFigures 2a-c, the ink was a suspension of carbon nanotubes (CNTs) in an aqueous suspension with 1% wt. of sodium cholate. In Figures 2a and b the writing could be accomplished on n type silicon and silicon oxide surfaces. In Figure 2c, the CNTs are written on an organic electron beam photoresist layer.
In Figure 2d an aqueous salt solution with 20% wt. silver nitrate is the ink while in Figure
2e and f a silver nanoparticle (50 nm dimension) in Downol DB suspension (Gift from Xjet Solar Ltd, Israel) is written. In Figure 2d and 2e, the solution and the suspension respectively were written on gold lines. In 2d the previously written lithographic structures had dimensions and separations that were too small to see in the optical microscope as resolved features but were clearly visible in the scanning electron microscopy image shown.In Figure 2e even previously written structures by other lithographic processes on the 1.5 micron level could be targeted and written on, due to the completely free axis from above as a result of the probe and SPM system geometry.. In Figure 2f, the writing across an interface between the gold and the SiO2 allowed for an AFM electrical probe to be placed on the SiO2 end of the written structures for the measurement of conductivity of the line with a counter electrode on the gold pad.
Control of the Writing Process : Voltage
The control of the writing process with FPN by imposed force of voltage or pressure is seen next in Figures 3-5. For the voltage control the nanopipette with its insulating glass walls allows for a variety of voltage options to be provided as indicated in Figure 3a.

Figures 3b-d, 4d-g show deposition of 1.4 nm gold nano particles (Nanogold®, Nanoprobes, Yaphank, NY, USA suspension in an organic solvent which in this case was methanol (1 mg/ml). Voltage was shown to work even with such an organic solvent. The voltage control allows for the use of pipettes with dimensions as small as 35 nm that are difficult to use with regular FPN. The best resolution can be seen on Figure 3c and d when a 35nm nanopippete wrote dots with diameter of 40nm and average height of 1.4nm which is the height of the single particle that was used.
Controlled Writing On Rough Real Substrates
The above writing was affected on generally flat surfaces. In Figure 4 the ability to accomplish complex tasks on rough surfaces with pressure control are shown. An example is the filling of a photonic band gap crystal with the fluorescent labelled protein BSA (Figure 4a).The subsequent near-field optical fluorescent image is shown in Figure 4b. Photonic band gap crystals guide light and are very sensitive to perturbations in their structure. The ability to affect such perturbations selectively using FPN is an important attribute that has many potential applications in photonics.An additional example also shown in Figure 4 is the demonstration of filling a deep trench with a suspension of 1.4 nm gold particles. The task accomplished in this case was the filling of a via with pure gold so that an effective contact could be made with the copper contact shown at the base (Figure 4c). The high aspect ratio of the nanopipette probes are very effective in this task and the results of the filling operation are shown in Figure 4 f and g.

Control of the Writing Process
The use of differential pressure in the controlled evolution of an ink is clearly shown in Figure 5. In Figure 5a the use of pressure to evolve gas in an aqueous medium is clearly evident while in Figure 5b and c, slits in a polymethylmethacrylate (PMMA) layer were accomplished with a nanopipette through which acetone vapor was effectively effused. The depth of the etching of the PMMA is clearly dependent on the speed of the relative motion of the nanopipette over the surface. These are the first examples of AFM controlled gas chemistry on a surface [9].
In addition, such pressure effects are of crucial importance in the AFM controlled deposition of macroscopic objects such as single cells and shown in [10].

Set-Point:
In Figure 6 another AFM parameter is altered and its effect on the line widths of different materials on different surfaces are compared. In Figure 6a, 50nm silver particles were written with the same pipette and conditions except that the set-point of the nanopipette was altered. It can clearly be seen that the larger force between the nanopipette and the surface led to higher particle concentration on both the Au and SiO2 surfaces across which the writing took place. An electrical AFM probe was placed on these lines with a second contact on the Au surface and the conductivity was measured. The written line at the extreme left of this image visibly had the largest concentration of particles and showed the highest conductivity. In Figure 6 b and c the ultimate resolution of writing BSA in aqueous media, using non-contact mode on a glass surface with low set point is shown and the line widths are between 50-100 nm. Note that such FPN protein writing [11] can be accomplished without protein modification which is difficult to accomplish with DPN.

Conclusion
The generality of the writing process with FPN as has been noted, is based on the manipulation of the wetting process on a nanometric scale. This is a multifaceted problem both from the practical aspects of the FPN and from the fundamental aspects of such processes on a nanoscale. An excellent review has recently appeared [12].
From the point of view of the practical aspects of FPN, there are the issues of how a liquid column emanating from the tip of a pipette wets the surface that is to be written on. However, there is also the question of the wetting behavior of the nanopipette itself. For example, how does the surface on the inside walls of the nanopipette behave vis a vis the solvent that will be used for the writing? Or, what is the nature of the outer walls of the pipette?
>In addition, from the perspective of the surface there is certainly the issue of whether the surface is hydrophobic or hydrophyllic or represents some intermediate state. But even these basic questions have to be complexed on the nanoscale with the roughness of the surface. Basically, roughness amplifies wetting behavior and such wetting behavior is best described by the contact angle. The contact angle is defined conventionally as the angle at the point where a liquid/vapor interface meets a solid surface (see Figure 7a). It quantifies the wettability of the solid surface. Thus, the issues of FPN nanowriting are at the forefront of nanotechnology both from an experimental and computational perspective. Thus, there is enormous fundamental work that can be accomplished in this area using the FPN technologies described in this paper..
Figure 7b and 7c show the effect of such wetting using an aqueous solution of 20% silver nitrate deposited on gold with 200 nm nanopipettes. A wetting agent BYK348 was added to the solution. When the concentration of the wetting agent was 0.003% wt. a contact angle of 65 with the gold substrate was measured and for such a contact angle lines of 80-110nm width were obtained as shown in Figure 7b. This was less than the orifice of the pipette used. On the other hand, the same pipette with the same solution but with 0.005% wt. of BYK348 gave a contact angle of 50+80 with the gold substrate and the lines were 600-700nm in width (see Figure 7c), more than the nanopippete aperture. Finally, when the concentration of the wetting agent was 0.001% wt, the contact angle was 78and no writing took place.
Finally, we should note that chemical characterization of the process of FPN is of great importance as we move forward. Thus, nanopipettes and all glass based probes, that have the attribute of exposed probe tips, allow with the SPM platforms we have employed a completely clear optical axis from above and below for full integration with techniques such as Raman spectroscopy. Using on-line Raman one can understand the chemical changes occurring during the writing but one can also understand both the chemical structure of the written pattern. A most appropriate example is a recent initial study that has shown that carbon nanotubes written by FPN on silicon oxide sitting on a bulk silicon substrate are highly oriented [13]. Further work on fully quantifying this effect is underway in our laboratories which has import both in the deposition of other forms of nanorods and in controlled polymer deposition that has been used to create polymer lenses for nanobiochip applications [14].

Summary
As can be seen, the application of FPN is diverse and has already matured in many important directions. However, the future is also very bright and some of the seeds of that future are already either in the germination form or are actively prevalent in the writings of those who have actively considered the technique. An example of the former is the controlled deposition of catalytic particles [15]. An example of the latter is the important
chromatography that was already noted earlier in the literature [16]. This could combine nanodeposition with chemical separation. Finally, the AFM systems and probes used in the work reported in this article are also able to be inserted into scanning electron microscopes and SEM/FIB systems [17]. Thus, the ability to, with AFM control, deposit gases or multiple gases with a high degree of local control could materially affect the quality of electron beam based lithographic methodology which presently has to fill the vacuum chamber of the SEM/FIB with specific gases for writing with electron and ion beams.
Published in
Learn Nanolithography
Tagged under
Monday, 04 January 2016 18:09
Nanonics customer profiled by SPIE for using a Nanonics AFM-SEM for optical transport work

Nanonics customer Dr. Nancy Haegel, of NREL, was profiled in SPIE for her work on transport imaging using photons to measure efficiency in solar cells. Dr. Haegel used a combined AFM-SEM for this groundbreaking work. More information on the Nanonics AFM/SEM/FIB instrument can be found on our website here. SPIE news profile of Dr. Haegel's work can be found here.

Published in
News
Tagged under
Sunday, 06 December 2015 13:09
thank you
Your message has been received. We will contact you in a few days.
Published in
Contact Information
Tagged under